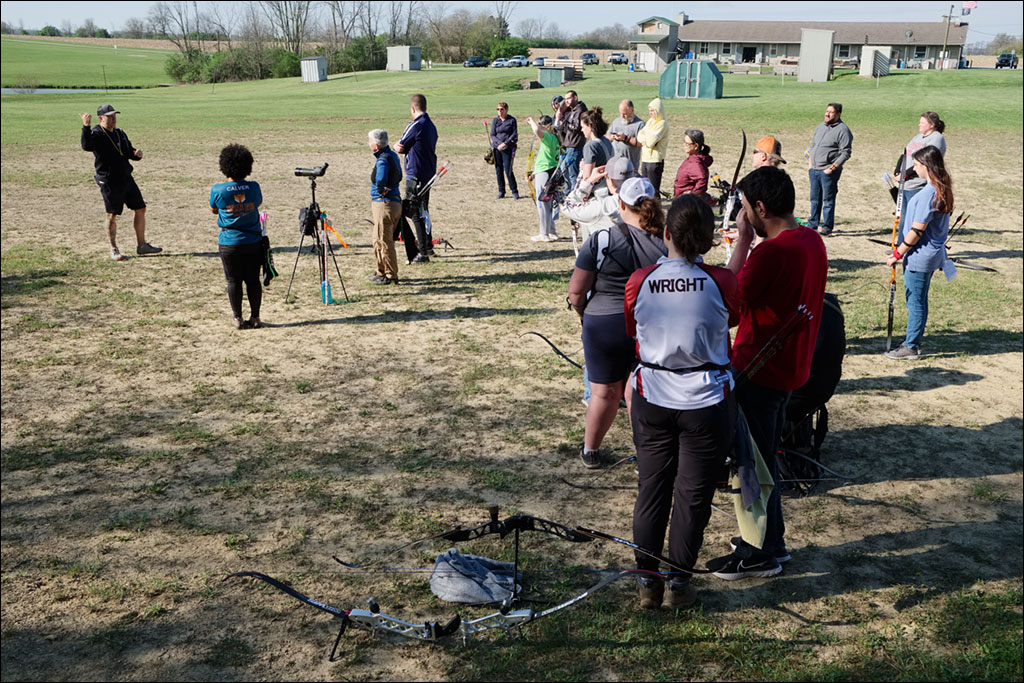
 Nearly 100 archers from the US and Canada attended the 2023 bootcamp. Matt Yacca led a group of archers on the last morning on the 50 m target distance. Click on the image for a larger view.
Tag Archives: William Ash
Single String Archery Club Bootcamp, 2023, Part 4
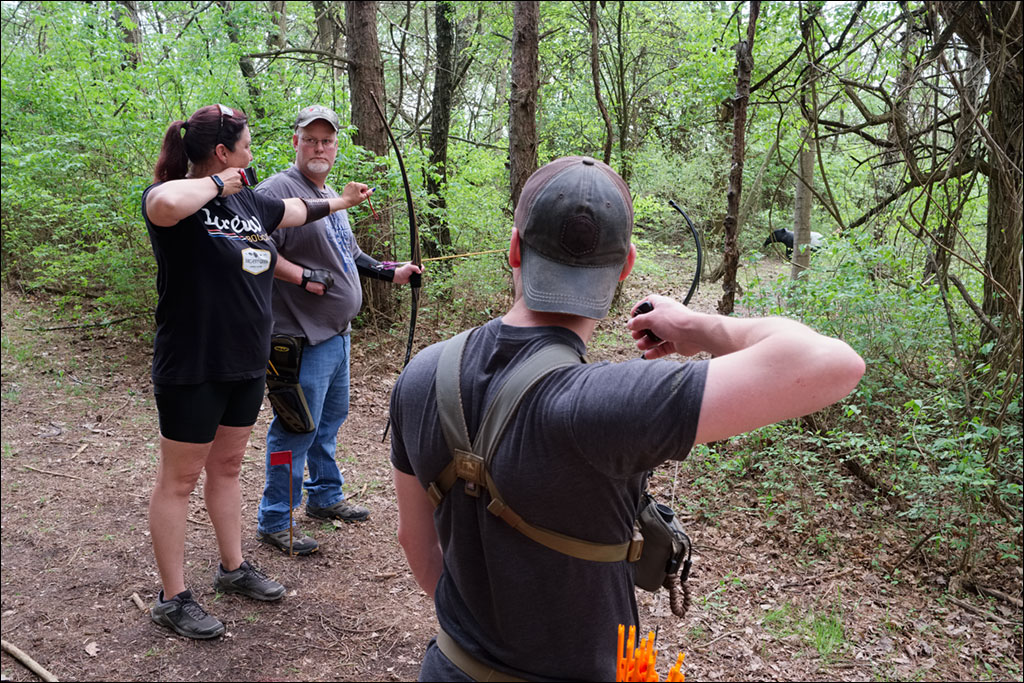
 Rod Jenkins, a well-known traditional archer and coach, helping a participant with her form. Form is critical in archery for both efficiency and accuracy. Rod is using an arrow to indicate the archer’s shoulder alignment. Click on the image for a larger view.
Single String Archery Club Bootcamp, 2023, Part 3
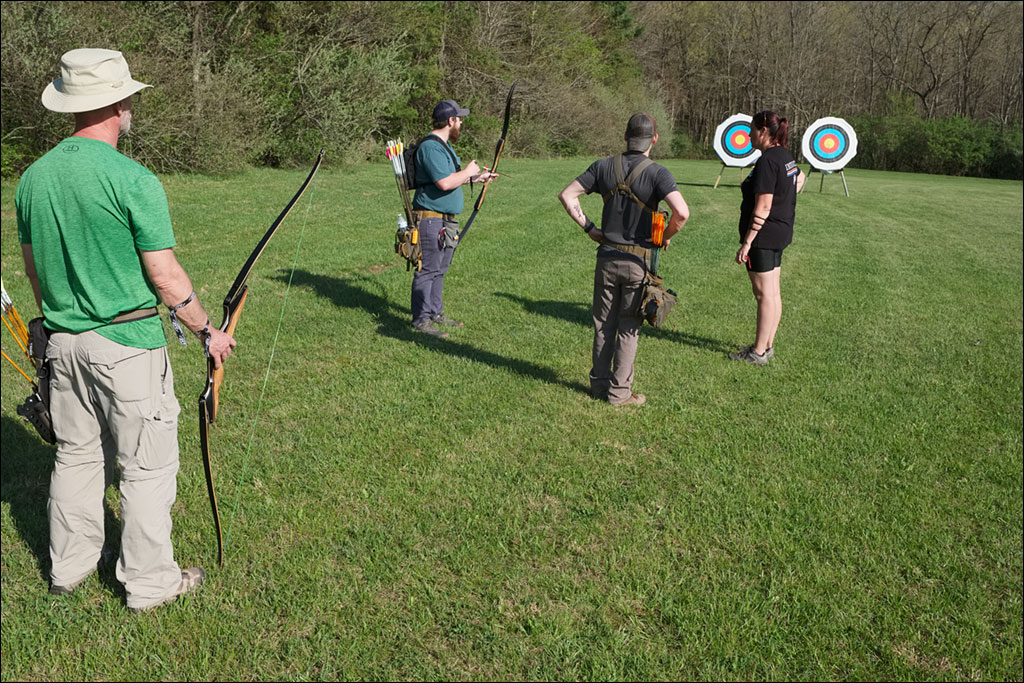 Fawn Girard helping archers with their outdoor target skills in the evening. For barebow recurve, the competition distance is 50 m. Click on the image for a larger view. Click on the image for a larger view.
Single String Archery Club Bootcamp, 2023, Part 2
 The bootcamp is an intense two days of hands-on instruction. Matt Yacca, a well-known national and international barebow archer, helped groups on their form. Smart phones and their ability to capture video become great educational aides. Click on the image for a larger view.
Single String Archery Club Bootcamp, 2023, Part 1
 This April, Naomi and I went to the Single String Archery Club Bootcamp. The bootcamp is two days of archery instruction and practice. The goals of the program is to help archers develop and to raise money to support competitive archers representing the United States at international competitions, such as the World Archery Field Championships and World Archery 3-D Championships.
Many of the instructors have represented the US at international competitions, like Fawn Girard on the right of the image. Fawn is a well-known and decorated barebow archer that competes in indoor and outdoor target archery, field archery, and 3-D archery at home and abroad. She is also a founding member of the Single String Archery Club. Click on the image for a larger view.
Cherry Blossom Season, Part 3
 Click on the image for a larger view.
Cherry Blossom Season, Part 2
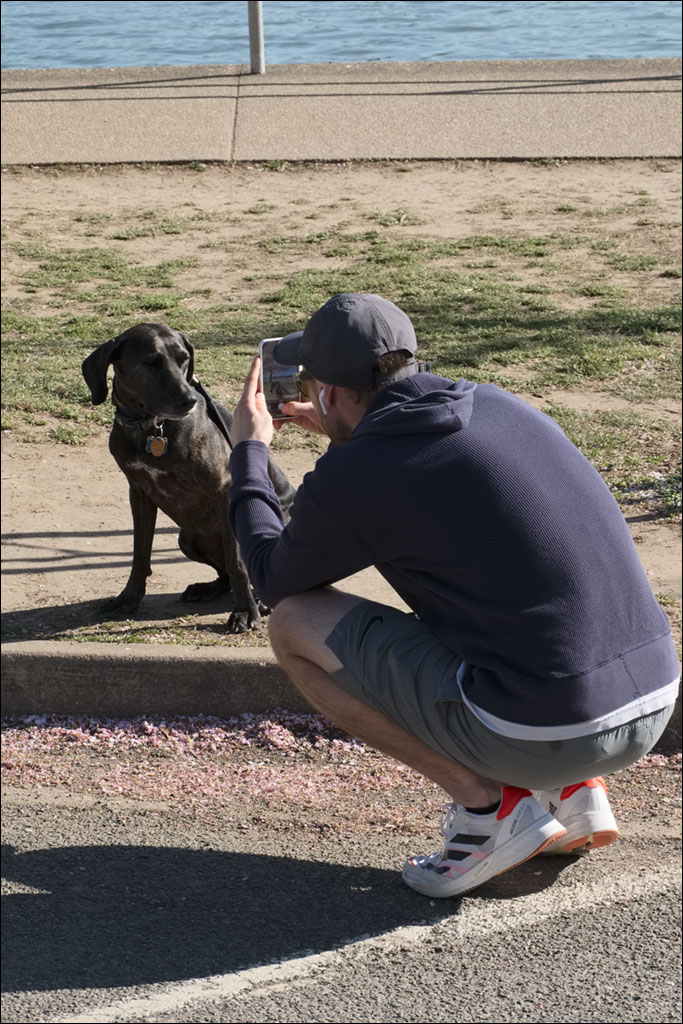 People enjoying the day along the Tidal Basin in Washington, DC. Click on the image for a larger view.
Cherry Blossom Season, Part 1
 Cherry trees in bloom near the Jefferson Memorial. Click on the image for a larger view.
Window
 Click on the image for a larger view.
Arches
 Click on the image for a larger view.